
Which South African equity unit trusts have delivered the highest historical returns over three, five and ten years? We have updated the rankings using the latest Morningstar data, combining the two relevant South African general-equity categories into one ranking universe while retaining each fund’s original ASISA classification.
A performance league table is useful. It is also very easy to ask it to answer a question it cannot.
These rankings tell us which funds produced the highest historical annualised returns over a specific period. They do not tell us which fund will lead from here, whether one fund is suitable for a particular investor, or whether the differences came from manager skill, investment style, market conditions, risk-taking or some combination of all four.
That distinction becomes particularly important when you compare three-, five- and ten-year tables. You can also compare the results with our global equity unit-trust rankings.

- Key Definitions
- How the Rankings Work
- Top 5 SA Equity Funds Over 3 Years
- Top 5 SA Equity Funds Over 5 Years
- Top 5 SA Equity Funds Over 10 Years
- Why the Eligible Universe Gets Smaller
- Which Funds Appear Repeatedly?
- What Rankings Cannot Tell You
- Frequently Asked Questions
- Rankings Are Evidence, Not a Portfolio
Key Definitions
ASISA South African Equity – General
South African equity portfolios investing across sectors and market capitalisations. Under ASISA’s current classification standard, a first-tier South African portfolio must invest at least 55% of its assets in South African investment markets, while an equity portfolio must hold at least 80% of its market value in equities.
ASISA South African Equity – SA General
A South African equity category with 100% of market value in South Africa.
Annualised return
The compounded average annual rate represented by a multi-year total return. It does not mean the fund earned the same return in every individual year.
Eligible peer universe
The number of funds in the defined category universe with a valid return covering the full measurement period, after benchmark and other non-fund comparator rows have been excluded.
Retail fund class
The retail class represented in the source dataset is used for each ranked fund. Reader-facing tables show the underlying fund name without retail-class suffixes or administrator identifiers where these do not help identify the investment strategy. The exact source series and class remain part of the internal reconciliation.
How the Rankings Work
For this article we combine the (ASISA) South African EQ General and (ASISA) South African EQ SA General categories into one ranking universe. The originating category remains visible because the two categories operate under different geographic constraints.
For the rankings, we use the retail fund class represented in the source dataset. Only funds with a valid return for the full measurement period are eligible. Benchmark and other non-fund comparator rows are excluded.
To keep the tables useful to readers, we display the underlying fund name rather than the source-data class code. Retail-class suffixes and administrative identifiers that do not help identify the investment strategy are omitted. The exact source fund and class remain part of our internal data reconciliation.
Returns over periods longer than one year are annualised. This means a five-year annualised return of 18% does not mean the fund earned exactly 18% in every individual year. It means its compounded return over the full period is equivalent to approximately 18% a year.
Performance data to 31 August 2026.
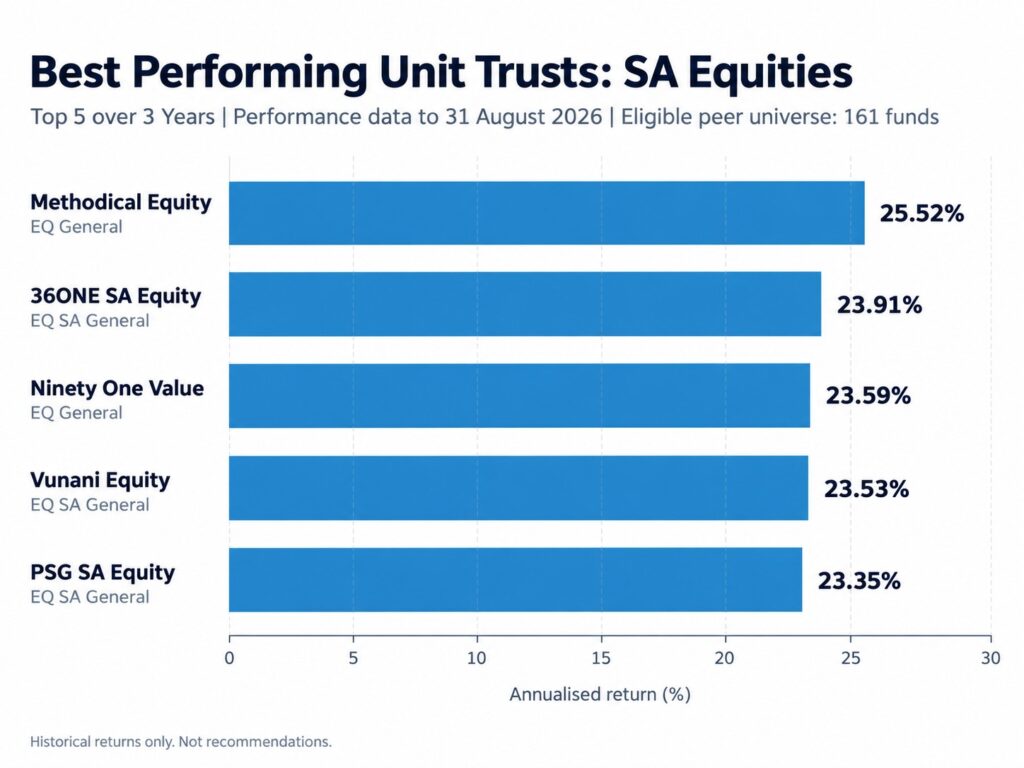
Top 5 SA Equity Funds Over 3 Years
161 funds had a valid three-year return.
| Rank | Fund | Originating ASISA category | 3-year annualised return |
|---|---|---|---|
| 1 | Methodical Equity | (ASISA) South African EQ General | 25.52% |
| 2 | 36ONE SA Equity | (ASISA) South African EQ SA General | 23.91% |
| 3 | Ninety One Value | (ASISA) South African EQ General | 23.59% |
| 4 | Vunani Equity | (ASISA) South African EQ SA General | 23.53% |
| 5 | PSG SA Equity | (ASISA) South African EQ SA General | 23.35% |
The spread at the top is relatively narrow. Less than 2.2 percentage points separate second and fifth place.
Methodical Equity leads the three-year table and also appears in both longer-period top fives. 36ONE SA Equity does the same. That persistence is worth investigating further, but it remains the beginning of a fund assessment rather than its conclusion.
Top 5 SA Equity Funds Over 5 Years
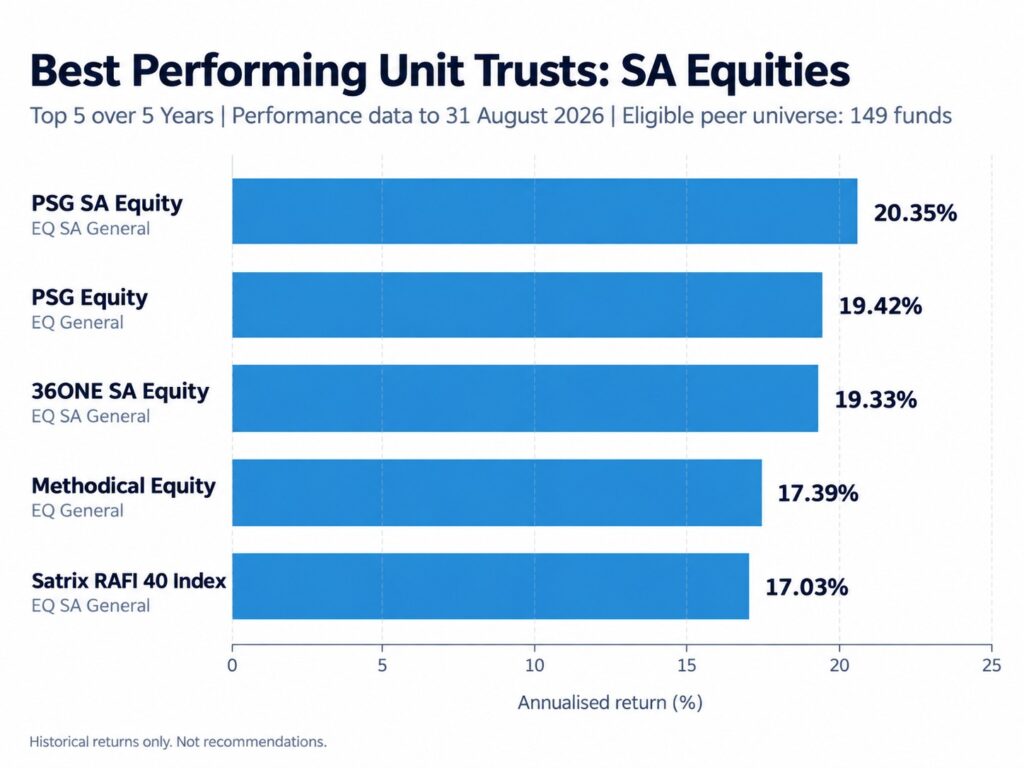
149 funds had a valid five-year return.
| Rank | Fund | Originating ASISA category | 5-year annualised return |
|---|---|---|---|
| 1 | PSG SA Equity | (ASISA) South African EQ SA General | 20.35% |
| 2 | PSG Equity | (ASISA) South African EQ General | 19.42% |
| 3 | 36ONE SA Equity | (ASISA) South African EQ SA General | 19.33% |
| 4 | Methodical Equity | (ASISA) South African EQ General | 17.39% |
| 5 | Satrix RAFI 40 Index | (ASISA) South African EQ SA General | 17.03% |
The order changes quite substantially.
PSG SA Equity moves from fifth over three years to first over five, while Ninety One Value and Vunani Equity — both in the three-year top five — do not appear in the five-year list.
Satrix RAFI 40 Index also enters the table. That is a useful reminder that a historical top-five list is not automatically a list of conventional active stock-picking funds.
Top 5 SA Equity Funds Over 10 Years
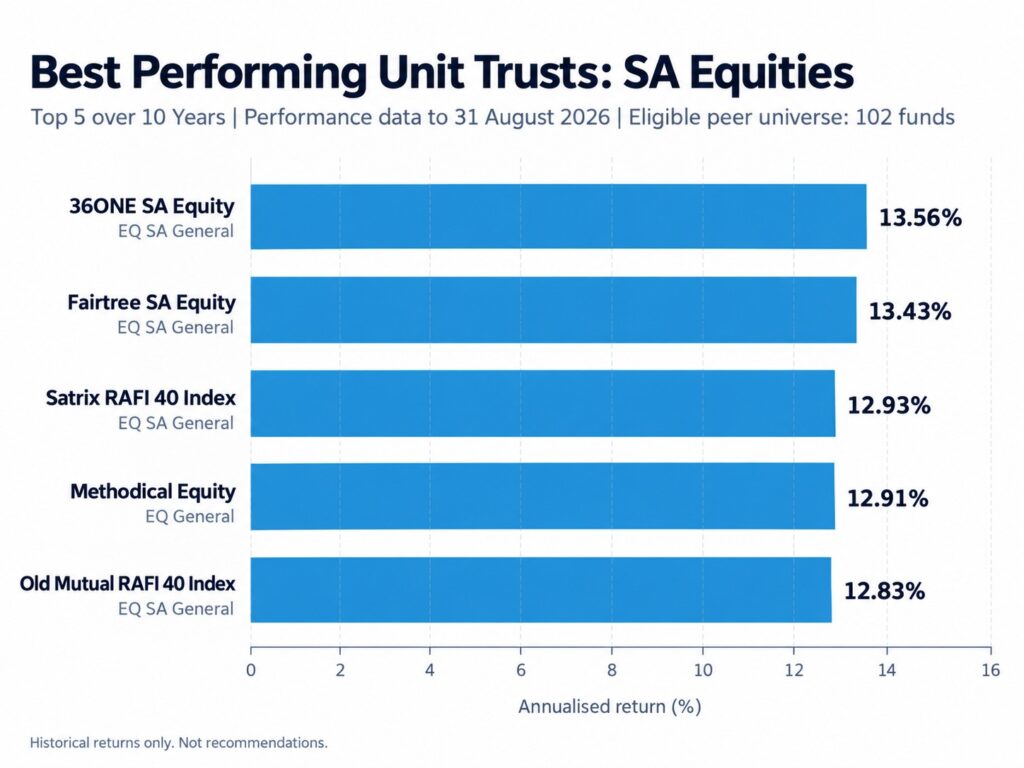
102 funds had a valid ten-year return.
| Rank | Fund | Originating ASISA category | 10-year annualised return |
|---|---|---|---|
| 1 | 36ONE SA Equity | (ASISA) South African EQ SA General | 13.56% |
| 2 | Fairtree SA Equity | (ASISA) South African EQ SA General | 13.43% |
| 3 | Satrix RAFI 40 Index | (ASISA) South African EQ SA General | 12.93% |
| 4 | Methodical Equity | (ASISA) South African EQ General | 12.91% |
| 5 | Old Mutual RAFI 40 Index | (ASISA) South African EQ SA General | 12.83% |
The ten-year list is arguably the most interesting precisely because it looks different again.
36ONE SA Equity moves to first. Fairtree SA Equity enters at second. Two RAFI index funds sit in the top five. And only 102 funds qualify, compared with 161 over three years.
None of those facts, taken individually, tells you which fund should be in a portfolio. Together, they tell you something more useful: the answer to “which fund has performed best?” changes materially depending on the period, mandate and available history you choose.
Why the Eligible Universe Gets Smaller
The three-year universe contains 161 funds. The ten-year universe contains 102.
The main mechanical reason is simple: a fund cannot have a ten-year return if the relevant retail fund class did not have a complete ten-year performance history at the start of the measurement period.
A fund absent from the ten-year table may simply be too young to qualify. Its absence should not be read as evidence of poor ten-year performance — it has no comparable ten-year figure in this dataset.
Conversely, a ten-year ranking is necessarily drawn from an older and smaller subset of today’s available funds.
There can also be genuine survivorship effects in investment datasets as funds close or merge over time, but this workbook does not provide enough information to quantify fund closures and mergers. It would therefore be misleading to label the difference in universe sizes as “survivorship bias” without further evidence.
Which Funds Appear Repeatedly?
Two names make all three top-five tables:
36ONE SA Equity
3 years: 2nd
5 years: 3rd
10 years: 1st
Methodical Equity
3 years: 1st
5 years: 4th
10 years: 4th
That is meaningful historical evidence. It tells us these funds ranked strongly across several different trailing periods ending on the same date.
What it does not tell us is why.
Before drawing a conclusion about a manager or fund, you would still want to understand the mandate, portfolio construction, style exposures, concentration, volatility, drawdowns, fees, investment team and process — and what role the fund is expected to play in the wider portfolio.
A ranking is a screening observation, not qualitative due diligence.
Historical Return Is Only One Part of Fund Selection
Return matters. But choosing a fund purely because it sits at the top of a league table creates an obvious problem: you only know who the winner was after the return has been earned.
A proper fund assessment normally asks a wider set of questions.
Mandate: What is the fund actually allowed to own? Comparing funds without understanding different mandates can create false equivalence.
Risk and drawdowns: What had to be endured to earn the return? Two funds with similar long-term returns can have very different paths.
Volatility and concentration: Is the result dependent on a narrow part of the market, a particular investment style or a handful of positions?
Fees: Historical fund returns reflect certain costs deducted within the fund, but an investor’s overall cost can also depend on the investment platform and advice structure.
Manager and process: Is there a repeatable investment process and a team capable of continuing to execute it? A return table cannot answer that by itself.
Portfolio role: A good fund in isolation is not necessarily a good addition to an existing portfolio. Holdings, factor exposures and diversification matter.
For a broader framework, see our guide to the principles of successful investing.
Frequently Asked Questions
What is the best-performing SA equity unit trust in South Africa?
It depends on the measurement period. To 31 August 2026, Methodical Equity ranks first in the combined universe over three years, PSG SA Equity over five years, and 36ONE SA Equity over ten years. Those are historical-return rankings, not judgments that any one of the funds is the “best” investment overall.
Why are there fewer funds in the ten-year ranking?
A fund needs a valid performance history covering the whole period to qualify. The combined universe falls from 161 funds with three-year returns to 102 with ten-year returns. Newer funds and newer retail classes therefore disappear from longer-period rankings even if their shorter-term performance has been strong.
Should I switch to a fund because it is in the top five?
A ranking on its own is not enough reason to buy, sell or switch a fund. Historical return needs to be considered alongside mandate, risk, drawdowns, volatility, fees, manager and process, diversification, tax consequences and the fund's role in the wider portfolio.
Does a high ten-year return mean the fund will continue to outperform?
No. A long track record gives you more historical evidence, but it does not remove uncertainty about the future. Market leadership, investment styles, valuation conditions and portfolios all change.
Are index funds included in these rankings?
Yes, where they fall within the relevant ASISA category and have the required performance history. In the current ten-year top five, Satrix RAFI 40 Index and Old Mutual RAFI 40 Index both appear. Their presence is useful evidence about this particular period, but does not settle the broader active-versus-passive debate.
Rankings Are Evidence, Not a Portfolio
There is value in periodically updating these tables. They show what actually happened rather than what investors or managers remember happening.
But their most useful lesson may be how unstable a simple “best fund” answer becomes once you change the time horizon.
The three-, five- and ten-year lists are different. The eligible universe changes. Some funds recur; others do not. And a ranking tells you nothing about whether the risk taken, investment mandate or portfolio exposure is appropriate for the next job your capital needs to do.
Use the tables as a research starting point — not as a shopping list.
If you want to compare the corresponding offshore universe, see our global equity unit-trust rankings. Our offshore investing guide provides broader context on international diversification.
A performance table can tell you what happened. It cannot tell you whether a fund fits your own portfolio. If you are reviewing existing investments, Henceforward can help assess the role, risk, costs and diversification of the funds you hold.
Performance data to 31 August 2026. Source: Morningstar data. Rankings exclude benchmark and other non-fund comparator series and include only funds with a valid return for the full measurement period. Figures are rounded to two decimal places. Returns over periods longer than one year are annualised.
Past performance is not indicative of future results. Historical rankings do not constitute a recommendation to buy, retain or sell any fund. This article contains general information and does not take account of any person’s objectives, financial position or needs.
Henceforward (Pty) Ltd is an authorised representative of Graviton Wealth Management (Pty) Ltd, FSP 8772.

Carl-Peter has been in the financial services industry since 2003 and launched Henceforward with Steven Hall in 2021. He focuses primarily on investment strategy and portfolio construction. Henceforward is a fee-only, flat-fee firm — no commissions, no product incentives