
There’s an old joke about economists having predicted nine of the last five recessions. I suspect something similar could be said about the number of stock market bubbles predicted over the years.
At almost any point in a market cycle, you’ll find someone confidently explaining why the whole thing is about to collapse. Occasionally, they’ll even get the timing right. The problem is that they may have been making the same prediction for the preceding five years.
I was reminded of this while listening to financial historian Edward Chancellor’s conversation with Wilfred Frost on The Master Investor Podcast. Chancellor has spent much of his career studying speculation, and he believes we’re living through another great bubble. His examples are fascinating and his conclusions fairly unequivocal.
Then I came across a FAST Graphs comparison of Cisco in 2000 and Nvidia today, followed by the latest FactSet valuation research. Both complicated the popular story. So rather than another prediction of an imminent collapse, I wanted to examine what a bubble actually looks like, how bad the consequences can be, and what investors can learn without pretending to know the ending.

- What is a financial bubble?
- Four centuries of speculation
- The recurring anatomy of speculation
- Cisco versus Nvidia
- Current market valuations
- Could the risk be in capital spending?
- Company success versus shareholder returns
- Why market timing is difficult
- Are we in an AI bubble?
- The investor lessons
- Frequently asked questions
- The real lesson
What exactly is a financial bubble?
Broadly, an asset bubble develops when prices become increasingly disconnected from plausible economic value, often because investors begin relying on further price appreciation rather than expected earnings or cash flows. Simple enough, until you try to identify one in real time.
Markets are forward-looking. A company trading at an apparently extraordinary valuation might grow into it. Another trading on a modest multiple could prove expensive if profits deteriorate. With new technology, nobody knows exactly how large an industry might become, how quickly it will develop or who will capture the profits.
Sometimes investors underestimate the economic impact. Sometimes they get carried away. And sometimes, rather inconveniently, they do both during the same cycle.
A rising share price is not evidence of a bubble in itself. The useful question is whether the economic assumptions supporting that price remain credible.
Look for recurring ingredients: a powerful narrative, stretched expectations, easy financing, speculative behaviour, excessive investment and eventually a gap between what was promised and what the economic reality can deliver. None, individually, is a reliable market-timing indicator.
Four centuries of getting carried away
One of the pleasures of financial history is discovering how familiar the patterns become, despite the extraordinary differences in technology and economic conditions. Human nature has proved considerably more durable than most financial innovations.
The South Sea Bubble, 1720: When the story becomes the investment
The South Sea Company was established partly to manage British government debt, with promised trading opportunities involving Spanish-controlled territories in South America. Britain and Spain, inconveniently, were often at war. The commercial reality proved rather less exciting than the expectations surrounding it.
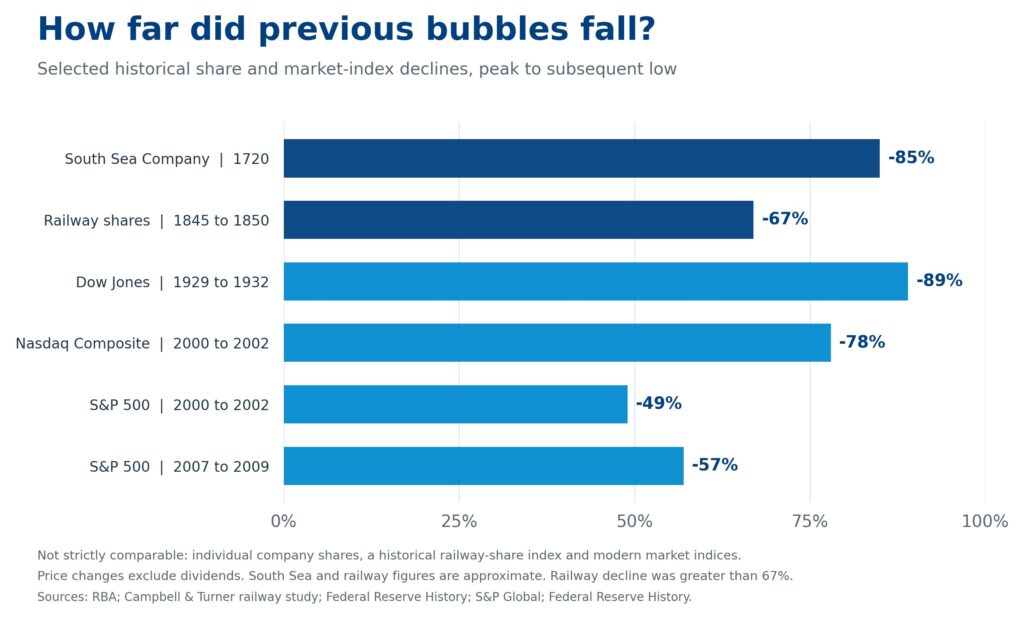
Financial engineering, political influence and speculation helped push shares from around £130 in February 1720 to more than £1,000 by early August. By the end of September they were back at approximately £150, a decline of roughly 85% in less than two months, according to historical research published by the Reserve Bank of Australia.
Investors didn’t necessarily need to understand how the company would earn those profits. For a while, it seemed enough that someone else might pay more tomorrow. Until they wouldn’t.
The lesson is that a compelling investment narrative can gradually replace an examination of the economics required to support it.
Railway Mania, 1840s: The technology succeeded; many investors did not
Railways genuinely transformed Britain, reducing journey times, connecting markets and changing commerce. The excitement was understandable. So was the temptation to finance every proposed line in sight.
New ventures proliferated, frequently using partly paid shares that exposed shareholders to further capital calls. As financing conditions tightened and investment commitments mounted, the boom unwound. Research by Gareth Campbell and John Turner finds that a broad historical index of railway shares roughly doubled between 1843 and August 1845, then fell more than 67% by the end of 1850.
The railway network continued expanding, even as many shareholders suffered deeply disappointing outcomes. An extraordinary technological revolution does not automatically mean extraordinary returns for the people financing it.
Indeed, the more compelling the opportunity, the more capital tends to chase it. Eventually, rising supply and competition can make the economics less attractive. That capital cycle is central to the current AI debate.
The Roaring Twenties: When everyone becomes an investor
The late 1920s combined genuine progress with increasingly speculative financial behaviour. Cars, radio, electrification and mass production were reshaping American life. Productivity was improving and new businesses were expanding.
Andrew Ross Sorkin revisits the period in his recent book 1929: Inside the Greatest Crash in Wall Street History and How It Shattered a Nation, first published in October 2025. Much of the economic optimism was justified. The financing arrangements were another matter.
Investment trusts flourished, more households bought shares and margin lending enabled people to control portfolios far larger than their own capital would otherwise permit. Rising prices encouraged borrowing; borrowing supported further buying. A wonderfully self-reinforcing arrangement.
The Dow Jones Industrial Average reached around 381 points in September 1929. By July 1932 it stood near 41, a decline of approximately 89%. The October 1929 crash was not the entire story. It was followed by years of falls and several convincing rallies that failed to hold. Federal Reserve History documents the crash and the wider financial consequences.
An investment that loses 50% must rise 100% to recover. One that loses 89% needs a gain of more than 800%. Margin calls and forced selling can make the spiral considerably worse, because heavily indebted investors may not have the luxury of choosing when to sell.
The crash and Great Depression were linked through banking failures, weak demand, monetary developments and policy decisions. The crash alone did not explain everything that followed. But the episode remains a particularly vivid reminder of what leverage does when confidence turns.
The dot-com boom: Right about the internet, wrong about the price
In the late 1990s, the internet was going to change everything. As it turned out, it largely did. But that did not make every dot-com company valuable, nor every valuation defensible. At times, profitability was treated as rather old-fashioned.
The Nasdaq Composite peaked in March 2000 and fell roughly 78% by October 2002, as described in S&P Global’s historical review. The much broader S&P 500 fell approximately 49% during its 2000–02 bear market. The Nasdaq did not regain its March 2000 closing high until April 2015. These are price-index comparisons, excluding dividends.
Many businesses disappeared. Others survived and ultimately helped transform economic life. Once again, investors identified a revolutionary technology but frequently misjudged the investment economics.
The Global Financial Crisis, 2007–09: When financing itself is the problem
Most readers will remember the next example more clearly. The Global Financial Crisis was less about a new technology and more about property, credit, financial engineering and the assumption that rising house prices would continue supporting a heavily leveraged financial system.
As mortgage defaults increased, losses spread through financial institutions and then the wider economy. Between October 2007 and March 2009, the S&P 500 declined approximately 57%. Federal Reserve History describes the financial and economic fallout.
The lesson is that speculation does not always require an exciting new invention. Sometimes the supposedly reliable asset is residential property. The common ingredients may simply be leverage, confidence and the assumption that recent conditions will continue.
The recurring anatomy of speculation
Across these episodes, the pattern is familiar. A persuasive story attracts capital. Rising prices reinforce the story. Investors become comfortable with valuations that once seemed unreasonable. Borrowing and business investment increase. Eventually, the economics struggle to meet the expectations.
But a bubble is not simply a chart of rising prices. It is worth examining the narrative, valuations, financing, end demand and expected return on the capital being committed. As our article on the psychology of wealth and investing explores, confident crowds can make questionable decisions feel perfectly reasonable.
This also helps explain why an industry can experience speculative overinvestment without every share associated with it becoming excessively valued. The distinction matters.
Cisco in 2000 versus Nvidia in 2026
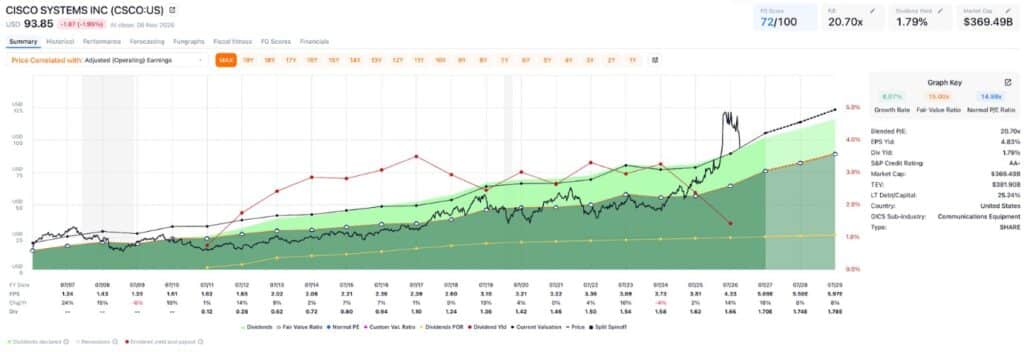
The supplied FAST Graphs research compares two infrastructure champions of their respective eras. Cisco supplied routers and networking equipment during the dot-com buildout. Nvidia sells much of the computing hardware supporting today’s AI investment. The analogy is useful, but only if we examine the numbers.
Cisco: A great business at a terrible price
Around the March 2000 peak, Cisco traded at roughly 100 times earnings, depending on the measure used. That price assumed an extraordinary amount of future success. When telecommunications customers sharply reduced infrastructure spending, the business itself suffered.
Cisco’s fiscal 2001 annual report recorded an additional excess-inventory charge of about $2.2 billion during the downturn. Combined with extreme starting valuations, deteriorating demand was particularly damaging.
Cisco continued operating, generated profits over the following decades and eventually recovered. Yet the FAST Graphs research records that its nominal share price did not close above the March 2000 peak until December 2025. That comparison excludes dividends and inflation, and can vary with adjustments for corporate actions. It nevertheless shows how long unrealistic starting expectations can weigh on a share.
Nvidia: A different picture, but still a difficult forecast
Compare that with Nvidia’s official August 2026 results. In its quarter ended 26 July 2026, revenue reached $96.2 billion, up 106% year on year. Data-centre revenue was $89.0 billion, the GAAP gross margin was 75%, and GAAP net income was $59.7 billion. These are reported results, not promises of future profitability.
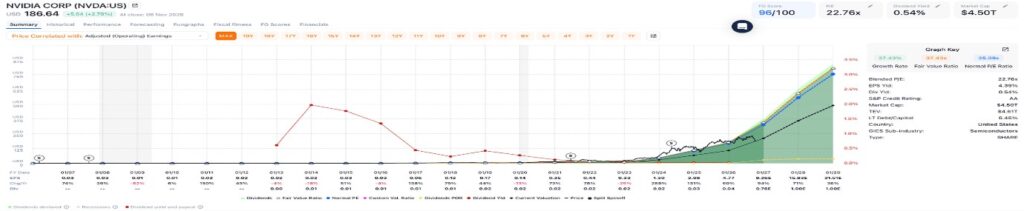
The FAST Graphs research shows that Nvidia’s earnings grew even faster than its share price over the long period examined. At its early-November snapshot it reported a blended P/E of about 23 times. That figure is not strictly comparable with Cisco’s historical peak multiple, as the earnings definitions and dates differ.
None of this proves Nvidia is cheap or guarantees attractive future returns. It does, however, make the claim that Nvidia must be a bubble because its price has risen so far considerably less convincing. The question shifts from whether current earnings exist to how durable they are.
What today’s wider market valuations actually tell us
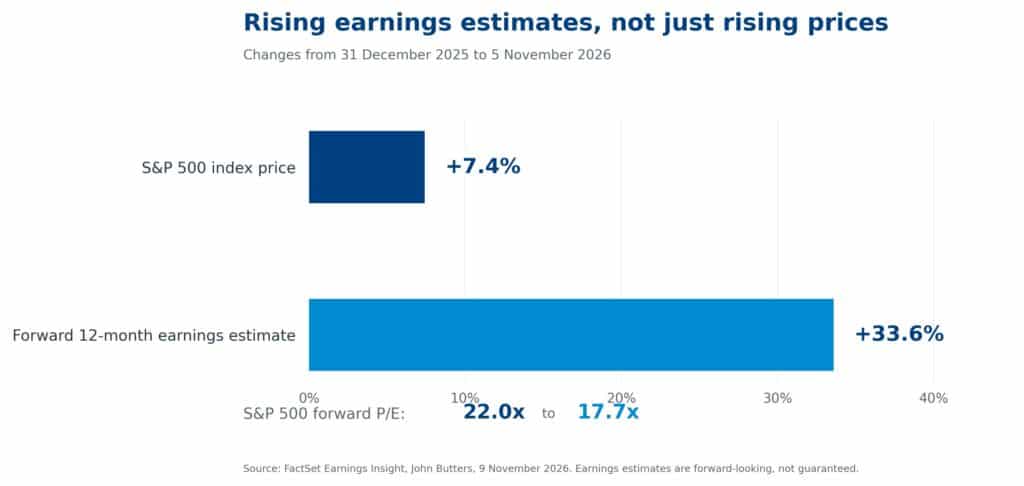
This is where the 9 November 2026 FactSet research becomes particularly useful. On 5 November, the S&P 500 traded on a forward twelve-month P/E of 17.7, against five- and ten-year averages of 19.8 and 19.1 respectively. Information Technology traded at 17.3 times forward earnings, below its 25-year average of 20.0.
| Valuation measure | Forward P/E |
|---|---|
| S&P 500, 5 November 2026 | 17.7× |
| S&P 500 five-year average | 19.8× |
| S&P 500 ten-year average | 19.1× |
| Information Technology, 5 November 2026 | 17.3× |
| Information Technology 25-year average | 20.0× |
At the end of 2025, the S&P 500 forward multiple was 22.0. Between then and 5 November 2026, the index price rose 7.4%, but its forward earnings estimate increased by 33.6%. The multiple fell substantially even though prices were higher. The denominator had been doing the heavy lifting.
This is not an all-clear. The index still traded above its longer-term 20- and 25-year average valuations. It also contains companies with very different prospects. And future earnings are estimates, not guaranteed cash in the bank. A market that looks reasonable on optimistic forecasts can become expensive very quickly if those forecasts are cut.
Current valuations are only half the question. The other half is whether the earnings underpinning them can be sustained.
Could the real vulnerability be hiding in capital expenditure?
The strongest parallel between the dot-com buildout and today’s AI cycle may not be share-price multiples. It may be the enormous amount of capital being committed to infrastructure.
Technology companies are investing in data centres, chips, energy infrastructure and networking equipment. Some buyers have huge established cash flows and strong balance sheets. Others depend much more heavily on borrowing, external investment and revenue that has yet to materialise. Treating them as economically identical misses the point.
Demand today is clearly real. Nvidia’s results demonstrate substantial sales, and Cisco reported $9.3 billion of AI infrastructure orders from hyperscale customers in fiscal 2026. But demand for equipment is different from profitable demand for the services that equipment will eventually produce.
Will end customers pay enough for AI services to justify this level of spending? Will computing capacity become plentiful? How rapidly will hardware need replacing? What happens if expected returns fail to emerge?
Suppose demand for a technology grows by 40% annually, but the industry expands capacity by 70%. The technology can be an enormous success while excess supply drives down prices and investment returns. The railways and telecom networks offer uncomfortable precedents.
The financial health and return on capital of the buyers may matter as much as those of the suppliers.
A great company is not necessarily a great investment
A company’s operational performance and the return earned by a shareholder are not the same thing. Over shorter periods, changes in the valuation investors are willing to pay can overwhelm business growth.
Imagine a company earning R10 a share and trading on a P/E of 20. Its share price is R200. A few years later, earnings have risen 50% to R15, a terrific result. But the market now applies a P/E of 12, bringing the share price to R180. Earnings are up 50%. The investor’s price return is down 10%, excluding dividends.
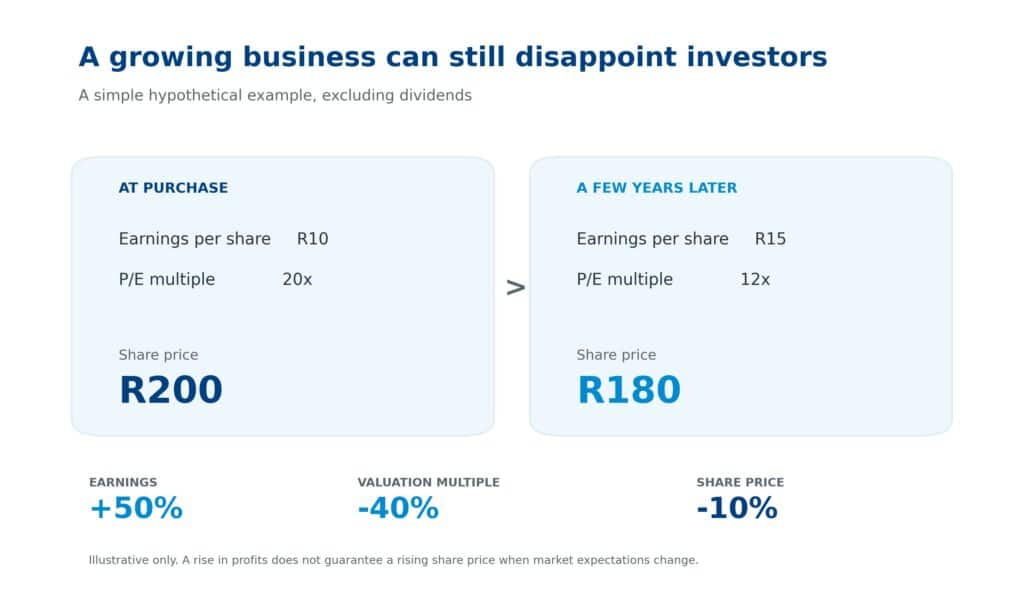
Nothing mysterious happened. The business grew and expectations changed. That is why identifying the fastest-growing companies or industries is not enough. The price you pay, and the durability of the profits you expect, matter enormously.
Our earlier essay, Beating the Market Is Not a Financial Plan, explores a related mistake: allowing useful market measures to replace the real objective of the investment.
Why recognising a bubble does not mean you can profit from it
Suppose Chancellor is right and a painful unwinding lies ahead. The obvious response might be to sell everything, hold cash and buy back when prices collapse. Except there is a rather large complication. When?
Markets can look expensive, remain expensive, then become far more expensive before correcting. A sceptic can be right about the eventual direction and still lose years of returns. Selling is only half the decision. Re-entering when earnings and headlines are deteriorating can be considerably harder.
The 1929 crash and dot-com collapse were not neat, uninterrupted declines. Both included substantial rallies on the way down. Investors who confidently planned to buy after a 30% fall often found that the real experience felt rather different from the thought experiment.
That does not make valuation, concentration or changes in financial risk irrelevant. It means decisions about exposure should arise from an investment policy and evidence, not solely from somebody’s confidence that the top is in.
So are we in an AI bubble?
I do not think the evidence supports a simple yes or no. There are clear reasons for caution: enormous investment commitments, extraordinarily optimistic assumptions in parts of the market, competition for scarce infrastructure and the uncertainty around future returns on that spending. Chancellor is right to draw attention to them.
But the counter-evidence matters. Leading suppliers are producing extraordinary revenues and profits. Some major customers can finance their investment internally. Market valuations differ from those of the dot-com era, and FactSet’s numbers show that aggregate forward earnings expectations rose much faster than prices during much of 2026.
There may be pockets of speculative excess in AI, alongside rational investment elsewhere. An industry can suffer from overinvestment without every supplier trading on an unreasonable multiple. And even an apparently reasonable multiple can be misleading if earnings expectations eventually collapse. These possibilities can coexist.
The public argument tends to be binary: either AI is the opportunity of a generation or the entire market is headed for disaster. Markets rarely oblige us with such tidy choices.
What should investors actually do with this information?
Financial history teaches that exuberance, leverage and overinvestment recur, that prices can become detached from economics, and that even transformative technologies can attract more capital than their eventual profits justify. What it does not give us is a reliable formula for forecasting the next peak or trough.
Nor is every bear market the bursting of a bubble. Recessions, changing interest rates, weaker earnings, inflation and unexpected events can cause severe market declines. Corrections are part of investing, sometimes profoundly unpleasant ones.
This is why we believe investment strategy should begin with the purpose of the money. Capital required to fund spending soon has a different job from investments intended for twenty years or the next generation. Liquidity, time horizon, inflation and the ability to withstand loss should shape the level of investment risk.
We explore that distinction in When Does Wealth Become Genuinely Surplus?. And for investors approaching retirement, The Five Years Before Retirement examines how liquidity and withdrawal timing change the consequences of market declines.
A well-considered policy also helps to make decisions before emotions take over. Diversification cannot prevent losses during a broad bear market, but it can reduce reliance on one company, sector or forecast. A strategy should adapt when facts and circumstances change, without being reinvented every time a persuasive commentator announces the next catastrophe.
For a more practical treatment of those principles, our Smart Investing guide provides a useful companion to this history.
Frequently Asked Questions
What is the difference between a financial bubble and a bull market?
A bull market is a period of broadly rising prices. A bubble involves prices becoming increasingly detached from plausible economic value, often alongside speculative behaviour or financing excess. Rising prices alone do not establish that a bubble exists.
How far can markets fall when a bubble bursts?
Past episodes have included a roughly 89% fall in the Dow between 1929 and 1932, a 78% fall in the Nasdaq from 2000 to 2002 and a 57% fall in the S&P 500 during 2007–09. These are historical price-index declines, not forecasts of the next bear market.
Can a highly profitable company still be in a bubble?
Yes. Investors may overpay for genuine profits if they assume unrealistic future growth. A great company can be a disappointing investment at the wrong price.
Is the AI boom another dot-com bubble?
There are similarities in investment enthusiasm, infrastructure spending and uncertainty about long-term returns. But current profitability and valuations differ significantly across companies. A single industry-wide label conceals more than it explains.
Should investors sell everything if they expect a crash?
A correct concern about valuation does not identify when a decline will begin or when to re-enter. Exposure decisions should depend on concentration, liquidity, time horizon, capacity for loss and a considered investment policy, with personal circumstances assessed separately.
The real lesson from 400 years of speculation
Financial history is fascinating partly because it shows us how much changes and how remarkably little changes. The South Sea Company, Victorian railways, the Roaring Twenties, dot-com businesses and today’s AI infrastructure companies occupy different economic worlds. Yet ambition, innovation, optimism, incentives and human behaviour keep reappearing.
Sometimes they produce extraordinary economic progress. Sometimes extraordinary financial losses. Quite often, both.
There will be another major bear market. It may begin sooner than expected, or after several more years of rising prices. It may be short-lived or deeply uncomfortable. I have no particular confidence in predicting which.
What I do expect is that investors will continue to hear convincing arguments for why markets can only go higher, followed eventually by equally convincing arguments for why they can only go lower. Both will sound sensible at the time.
The challenge is not to become exceptionally good at predicting the next bubble. It is to understand the risks, avoid paying unreasonable prices for unrealistic expectations, and build an investment strategy that does not depend on knowing exactly how the future will unfold.
After four centuries of financial speculation, that seems a rather more useful lesson than trying to identify the precise moment when the next bubble bursts.
Financial history is useful only if it improves the decisions you make today. Explore our Smart Investing guide, or discuss how your investment policy accounts for valuation risk, diversification and difficult market conditions.
This article is for general information and education only and does not constitute personal financial advice. Market and company data are sourced and dated to 11 November 2026 and may change. Historical price declines exclude dividends and inflation unless otherwise noted; historical figures and reconstructed indices are not strictly comparable. Past performance is not indicative of future results. Forward earnings and illustrative calculations depend on assumptions and are not guaranteed. Henceforward (Pty) Ltd is an authorised representative of Graviton Wealth Management (Pty) Ltd, FSP 8772.

Carl-Peter Lehmann, CFP® is a director and co-founder of Henceforward. His work focuses on investment strategy, portfolio construction and helping clients connect their investments to their wider financial plans.